Analytics · Tracking, dashboards, answers
Know what changed, and where to look next.
We set up tracking across Shopify, GA4 and ad platforms, and show where they disagree.
Three tools, three answers.
Trusted by 50+ brands


















Sample investigation
Three sources. Different questions.
Illustrative. One revenue figure, with the gaps explained.
Beyond GA4
GA4 tells you what. We tell you why.
GA4 is the camera. We are the detective.
GA4 on its own
- Bot traffic inflates engagement
- Cohorts built by hand
- Cookie-dependent tracking
- Data sampled at high volumes
- No way to open a single session
- Reports a day or more behind
- Retargeting on basic events
- Shows what happened
With Helium
- Bots filtered out by AI
- Ask in chat, answered live
- Privacy-first identity stitching
- Every session counted, unsampled
- Any session opened, with intent scores
- Session-level insight as it happens
- Retargeting only quality sessions
- Explains why it happened
“Our store, catalog, and paid finally started pulling in the same direction. Helium stopped the mismatch and revenue per visit moved 27% in 4 weeks.”
Ask and alerts
Ask what changed in your store.
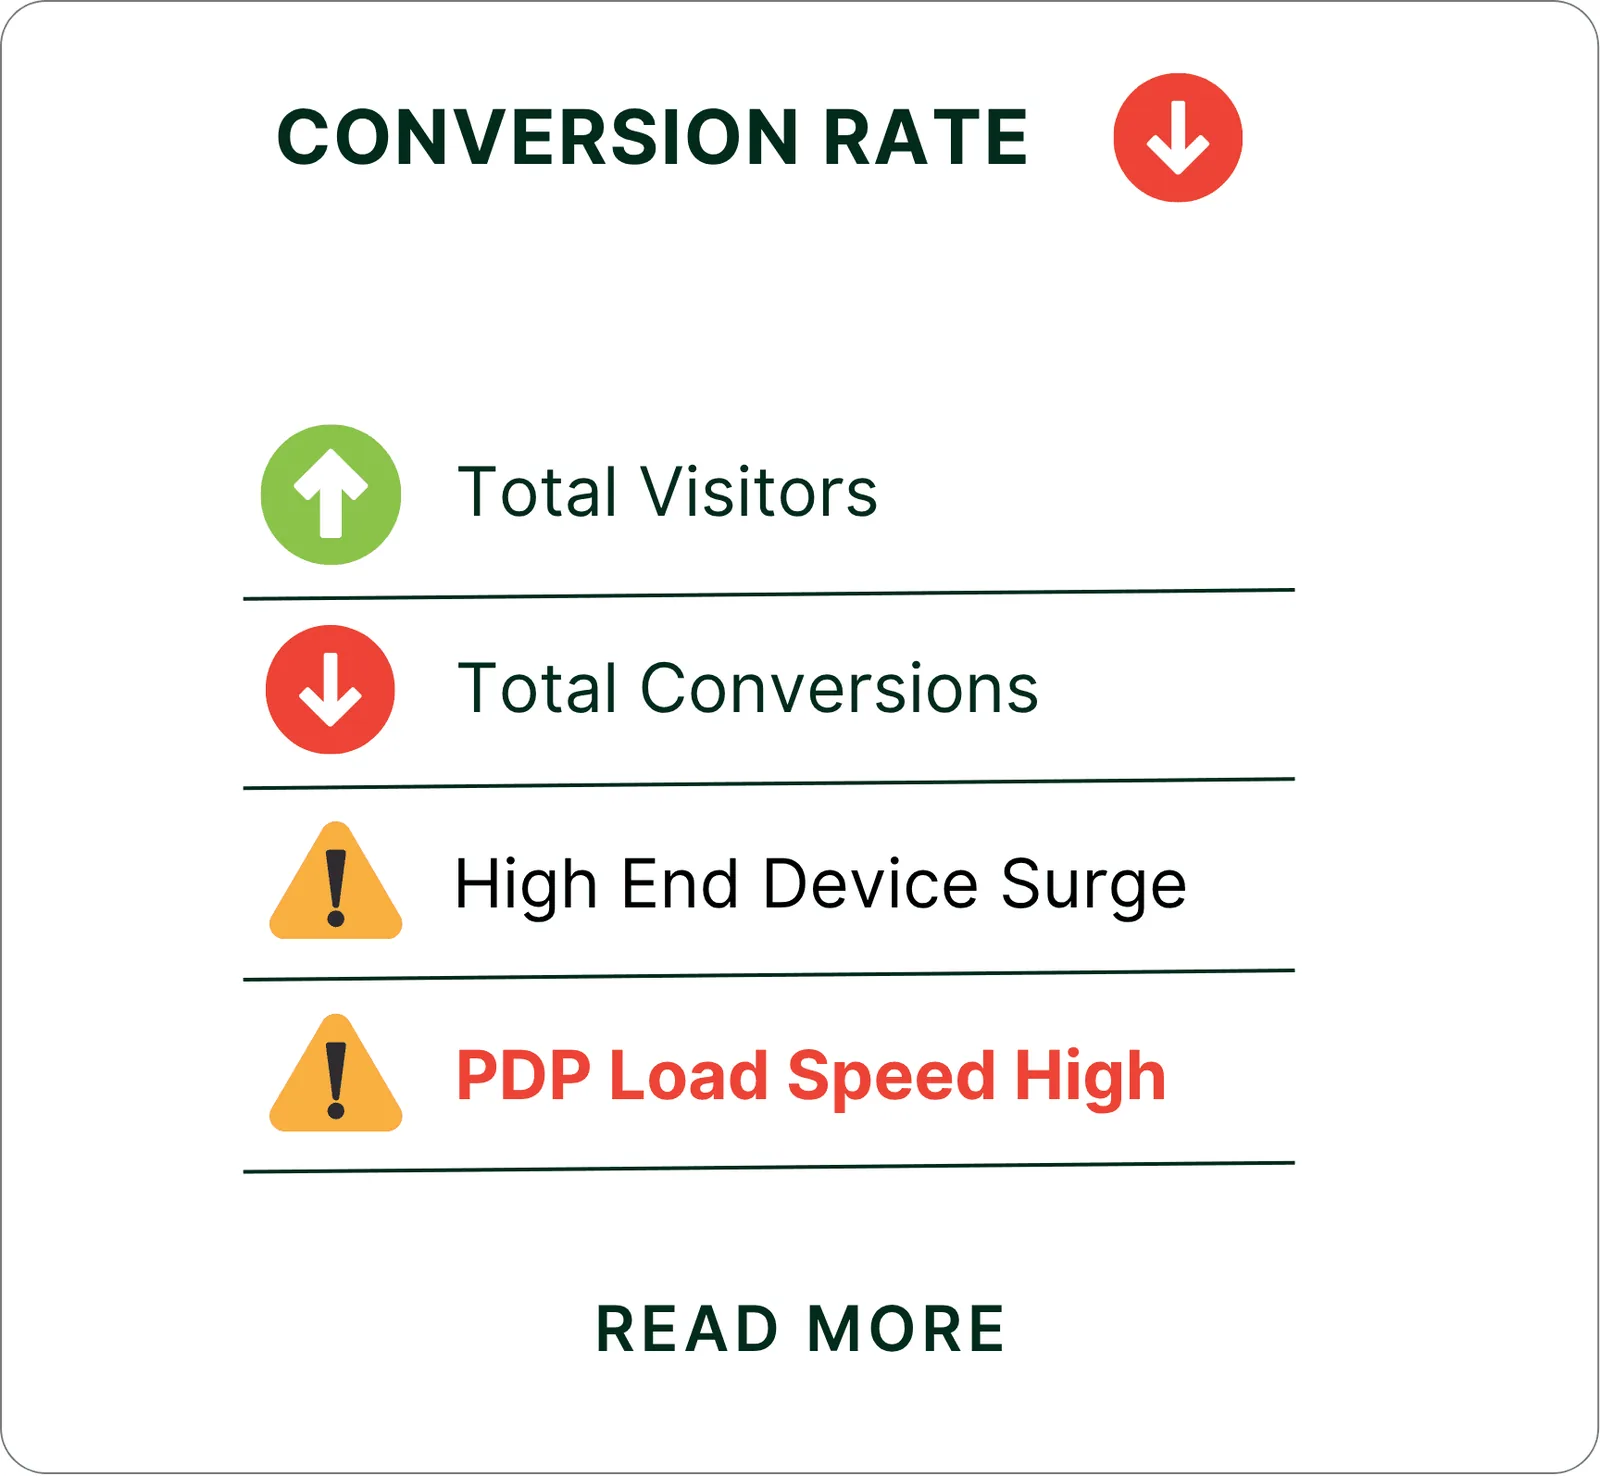
Plain English in, charts out. Alerts explain each dip.
What it catches
Answers, ranked by impact.
A PDP image failing on mobile outranks a desktop referrer glitch.
Catch it before revenue drops.
Each element on the page is tracked, so a dip comes with where and why. Fixes are ranked by revenue at risk.
- Anomaly alerts, with the likely reason
- Conversion likelihood score for every session
- Fix log shared by growth, product and dev
- Funnel drop-offs by segment, with the reason
- Lift forecast for a fix before you A/B test it
- Wasted spend by channel, campaign and behaviour
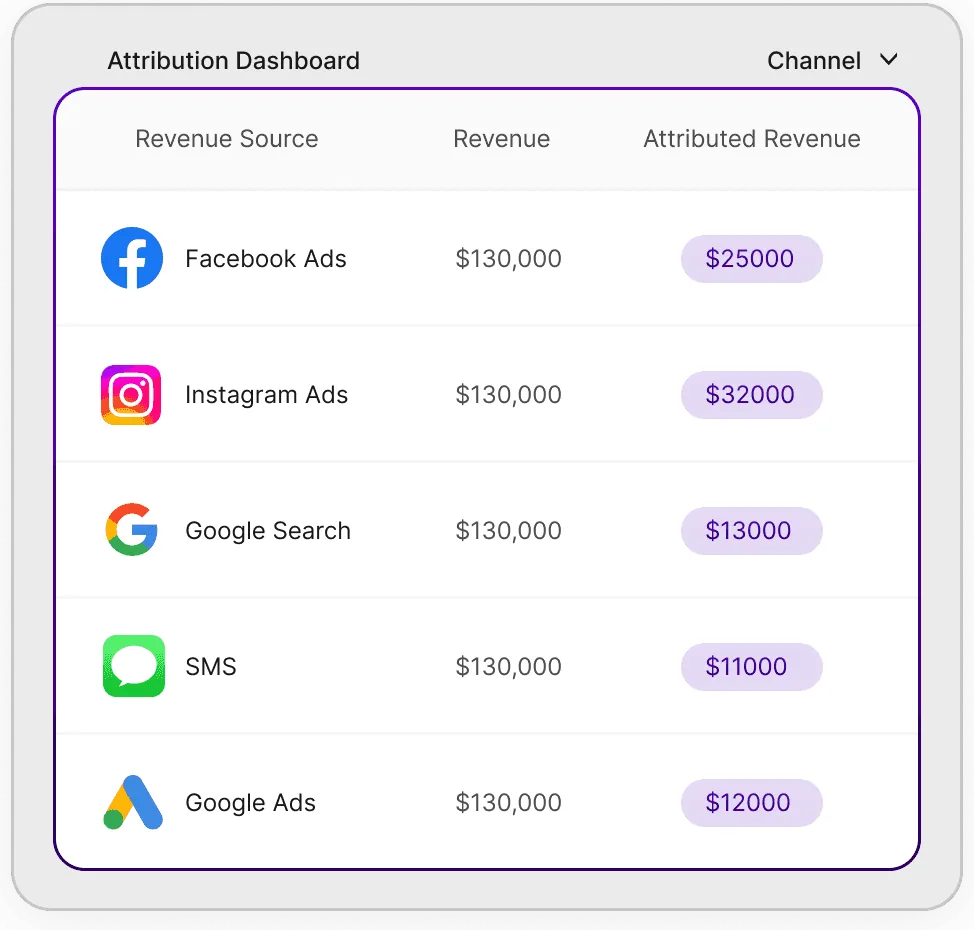
Credit where the sale was actually won.
Each touchpoint is weighted by how much it changed the chance to buy. No last-click double counting.
- By audience and creative
- By channel and campaign
- By SKU and product set
Ways to buy
Fix it, run it, or DIY.
Setup
Project quote
Quoted after a tracking audit.
- Metric definitions
- Reporting dashboard
- Tracking audit and fixes
Ongoing
Quoted monthly after scope
Weekly findings, fixed by our teams.
- Anomaly alerts
- Fixes routed to our teams
- Weekly findings in rupees
The app
Free to start
From $100/month on paid plans.
- Ask from Claude or ChatGPT
- Chat with your data
- Dashboards and alerts
Questions
Before you ask.
Can I ask from Claude or ChatGPT?
Yes. MCP servers let them query your store, read-only.
Do I need a developer?
No. Shopify connects in one click. Custom events and headless stores have optional developer hooks.
Do you need admin access?
No. Read-only OAuth access from day one, revocable any time.
Does it replace Shopify Analytics or the Meta Pixel?
No. It adds session quality, funnel leaks and revenue impact on top of them.
How are issues prioritised?
By revenue at risk, across channels and devices, so the costliest problem is fixed first.
Is there a dashboard?
Yes, on your agreed definitions. You can also build your own by asking.
What do you connect?
Shopify, checkout, Meta and Google Ads, plus GA4.
What does it cost?
Setup and ongoing work are quoted after scope. The app starts free.
What happens to the findings?
Our CRO and development teams fix them, with your approval.
Which definitions do you use?
Yours, agreed in week one.
Why not just use one number?
We report one, usually from Shopify. Other sources answer other questions.
Book a call
Which number don't you trust?
Tell us. We reply with what we'd check first.
Want to test us on content first? Get a free sample