
Why does a Meta account feel different in January, August, October, and December, even before the business changes its offer?
The answer sits inside Meta's own system as much as it sits inside seasonal demand. The platform sees different signal depth, different auction pressure, different creative decay, and different reporting noise at each point in the year.
The few numbers that change the whole picture
Signal | Insights | What it means for India D2C |
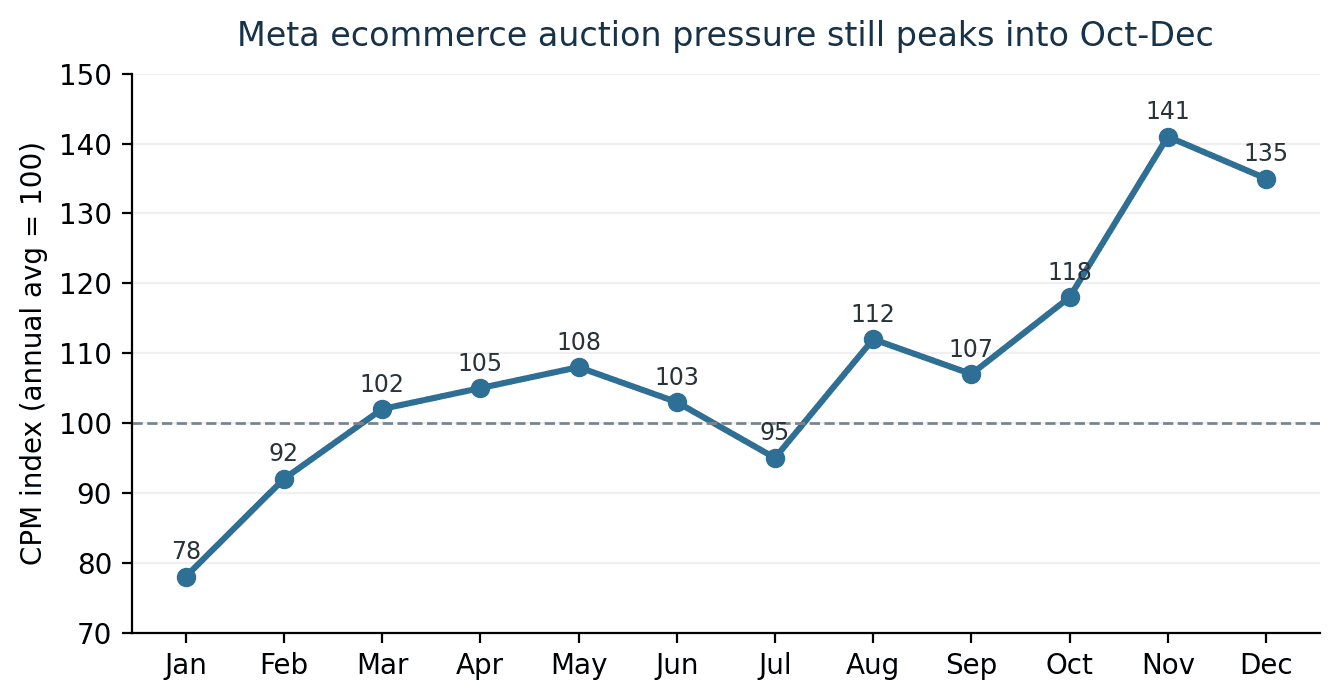
Meta scale | $58.1B ad revenue in Q4 2025; impressions +18%; average price per ad +6%. | The auction still tightens hard when year-end demand and advertiser budgets pile up together. |
Retrieval shift | Andromeda lifted retrieval recall 6% and ad quality 8% on selected segments. | Creative and signal quality have more room to shape delivery now because the model sees more candidates and scores them better. |
Automation | Meta tied AI-driven targeting features to a 22% ROAS lift and image generation to 7% more conversions. | Broad targeting plus richer creative is now a better default for many D2C accounts than heavy manual segmentation. |
India's festive influence | 65% of festive shoppers used Meta platforms, and 77% said a personalized ad inspired purchase. | Meta sits high in discovery and influence during India's long festive run, which starts earlier than many teams plan for. |
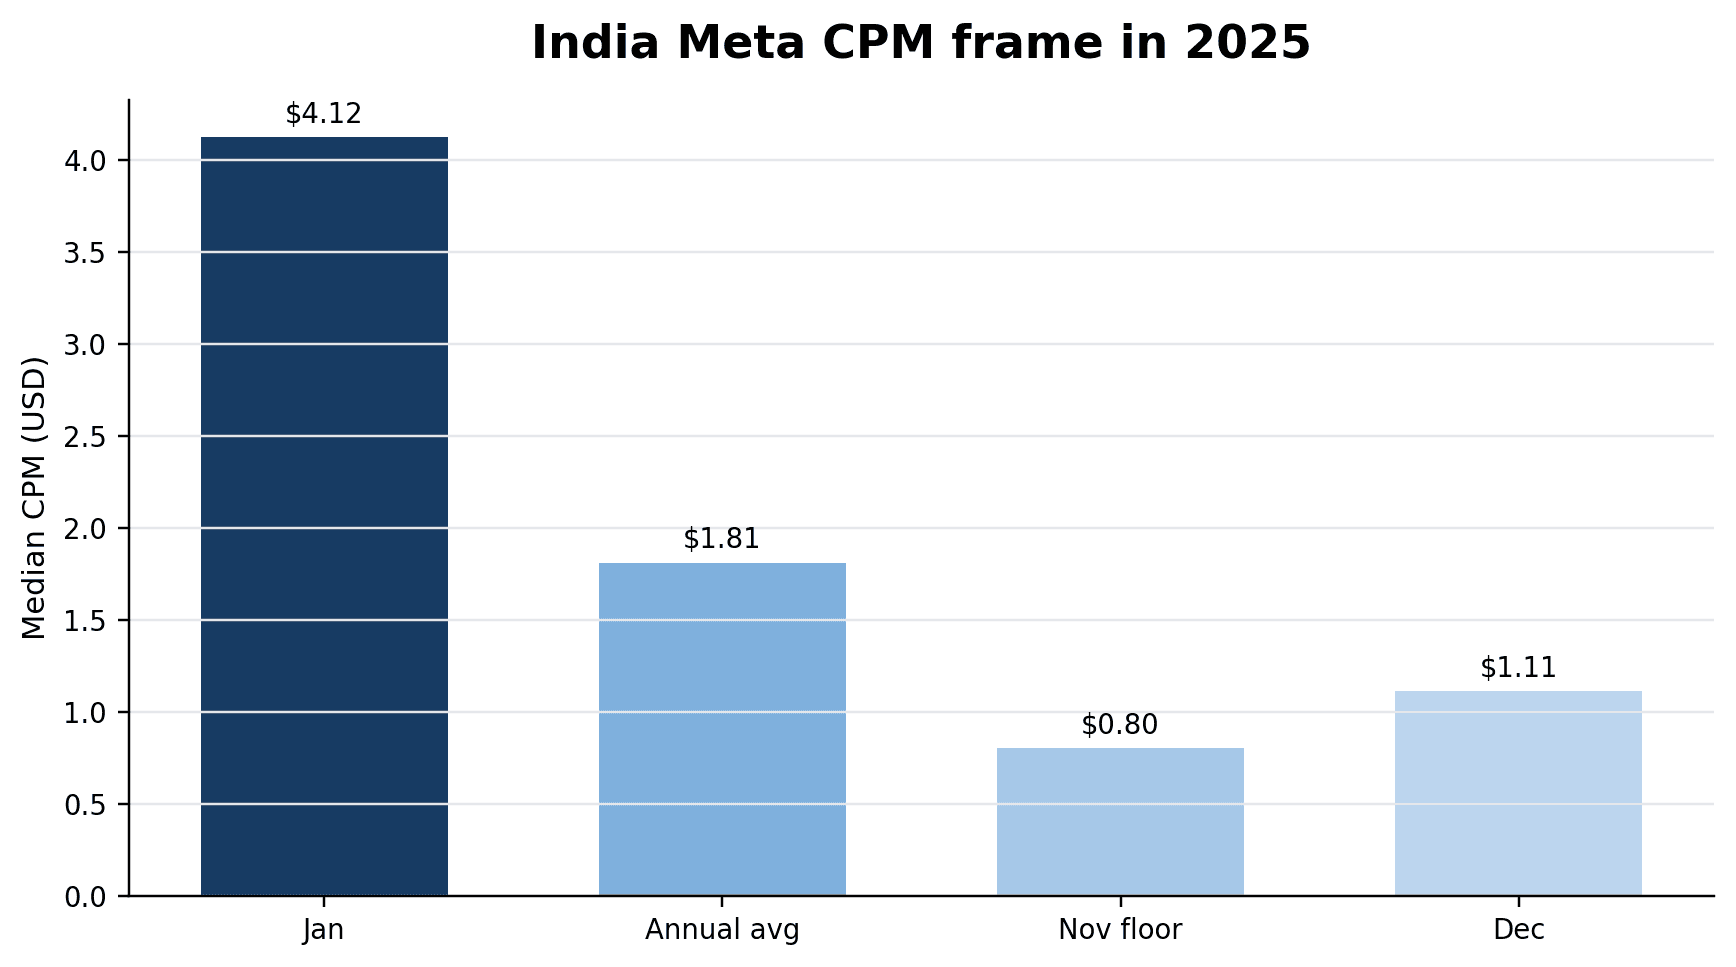
India's cost shape | Annual average CPC at $0.171, August at $0.270, and November at $0.110. | India does not simply mirror the US-style Q4 cost spike. Local demand, inventory, and channel mix can pull cost in a different shape. |
PLATFORM MECHANICS
What changed inside Meta
Meta delivery in 2026 runs on a more model-led stack.
The shift is bigger than ‘more automation’. Retrieval, ranking, creative expansion, attribution logic, and server-side signal capture all moved forward together.
That changes what broad targeting, creative range, and event quality look like inside a live account.
Shift | Hard signal | What it means for brands |
Andromeda retrieval | Andromeda improved retrieval recall by 6% and ad quality by 8% on selected segments. | The system can search more candidates and give stronger creative more chances to win. |
Advantage+ growth | Advantage+ campaigns represented 62% of e-commerce conversion spend in the MHI benchmark | Automation is close to default behaviour for scaled commerce accounts. |
GenAI creative expansion | More than 1M advertisers use GenAI tools to create 15M ads in a month. | Creative volume rises faster; weak near-duplicate assets get exposed faster too. |
Attribution reset | Meta changed website conversion attribution in March 2026, so link clicks count separately from engage-through events. | Short-window drops around that date need annotation before anyone calls the account broken. |
CAPI adoption | Ecommerce CAPI adoption is high, but platform undercount can still run 20–30% | Measurement quality still decides how fast the system learns, especially when demand cools. |
Once delivery became more model-led, the calendar stopped acting on a simple media channel. It started acting on a system.
What Meta starts to feel throughout the year
Meta does not become expensive or unstable for one reason. Several pressures move together: auction density, learning instability, creative fatigue risk, retargeting pool depth, and attribution noise. When those pressures combine, the same account starts to feel like a different machine.
Then India bends the machine
The local Meta market stays far below global price levels and shows sharper month-to-month swings. That matters because Indian D2C teams often borrow global Meta advice and then misread their own account when India behaves on a different rhythm.
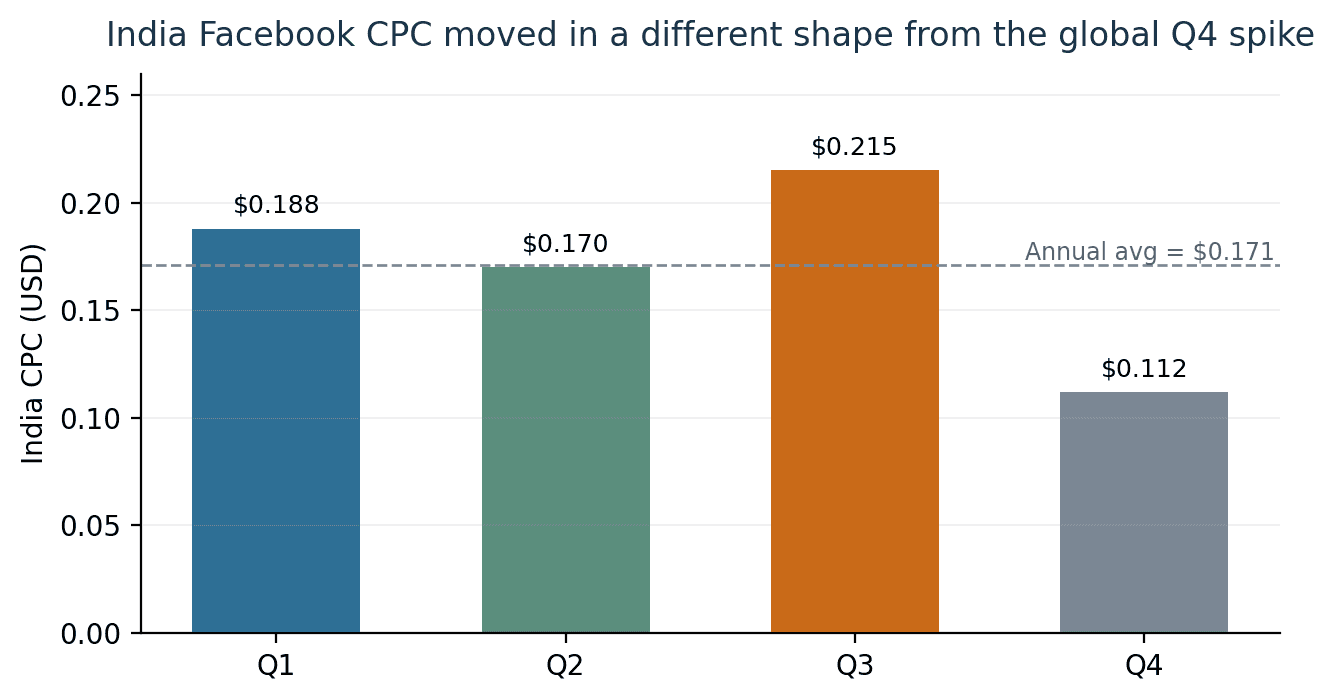
Superads' India CPC benchmark puts Q3 as the most expensive quarter in 2025. The gap to the global market widened most in November, when India was about 92% below global CPC levels.
That is why borrowed global playbooks often produce bad reads in India.
The platform is the same. The market it is pricing is not.
Meta runs through four operating states in India
Once Meta and the local market are read together, the year becomes clearer.
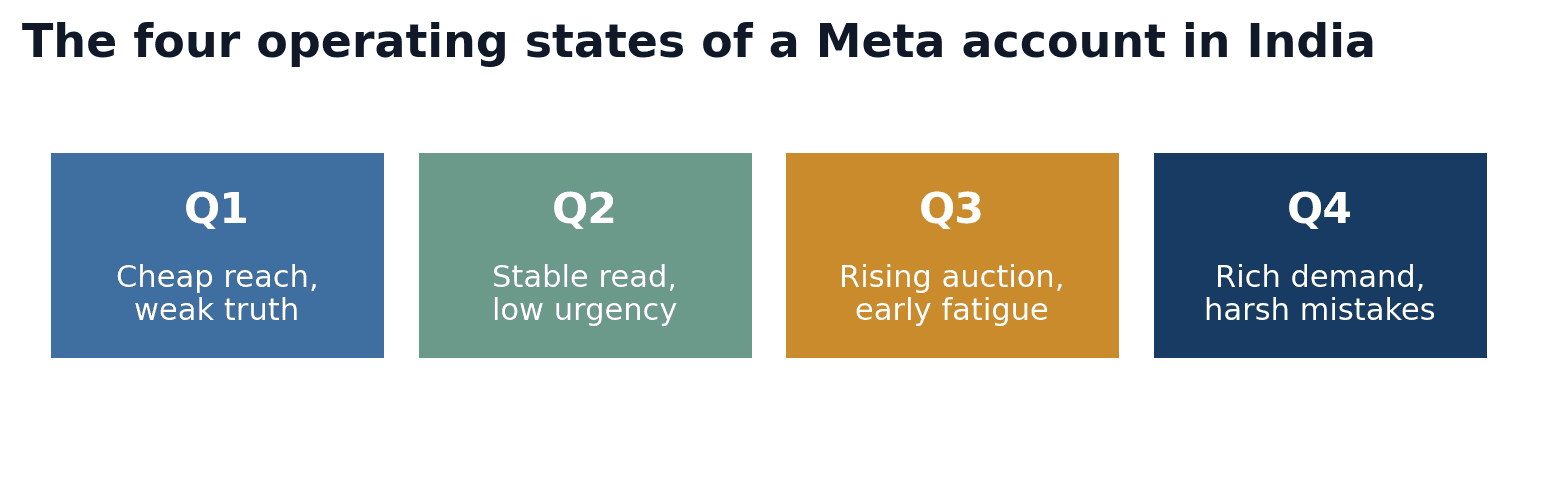
A Meta account in India moves through four operating states. Each state makes different things easier, exposes different weaknesses, and demands different operator moves.
Quarter | Meta state | What usually improves | What usually breaks | Best move |
Q1 | Cheap reach, weak recent purchase labels, slow dashboard truth. | Prospecting tests, broad audience learning, lower reach cost. | Teams push for December-style purchase efficiency and cut winners too early. | Lower spend, longer read windows, heavy CAPI hygiene, new creative testing. |
Q2 | Most stable period in many accounts. | Cleaner experiment readouts, steadier CPA, clearer creative ranking. | Complacency; teams delay creative building until the next pressure window. | Build new winners and widen first-party signal depth. |
Q3 | Auction starts climbing again before the main festive burst. | Top-of-funnel volume, audience warming, better pool-building for Q4. | Budget ramps move faster than creative refresh; fatigue starts earlier. | Raise spend in steps, add fresh hooks, harden landing-page fit. |
Q4 | Richest demand, deepest remarketing pools, hardest auction. | Fast scale, strong remarketing, high intent. | Frequency creep, steep marginal CPA, weak offer logic exposed in costly traffic. | Scale proven units only, watch marginal metrics daily, refresh creative faster. |
Demand does not replace the Meta story. It feeds it.
Meta does not create the calendar. It prices the calendar. India’s retail pattern changes the size, quality, and speed of the signals Meta receives. That is why the demand layer still matters in a Meta-first report.
The creative and placement shift inside Meta India
Meta's yearly behavior is no longer just an auction story. It is also an inventory story.
When Reels, creators, personalized ads, WhatsApp, and collaborative ads carry more of the shopping journey, the account behaves differently even before any bid change.
65% of festive shoppers used Meta platforms and 77% said a personalized ad inspired a purchase.
Reels was the most influential format in apparel and fashion, with creator content carrying strong deal and review influence.
92% of surveyed users preferred Reels over other short-form formats and 80% of Indians discovered new brands on Meta platforms.
Short-form video is now a daily behavior for 97% of consumers in the study, creator-led work can lower acquisition cost, and Indian retailers using omnichannel optimization saw 4x+ omnichannel ROAS lift.
Meta shift | Account effect | Operator response |
Reels-led discovery | More reach sits in fast-scroll, short-attention inventory. | Judge creatives by hook and hold speed before you judge them by final ROAS. |
Creator-led trust | Mid-funnel quality improves when proof feels local and human. | Use creators and UGC earlier in the funnel, not only for remarketing. |
Personalized ad relevance | Meta has more room to match creative to intent clusters. | Feed the engine distinct creative angles, not tiny cosmetic variants. |
Collaborative / quick-commerce ads | Purchase can happen in the same session, especially in impulse categories. | Treat catalog quality and retailer-path integration as performance work, not just merchandising work. |
The same Meta state does not hit every category in the same way
Each category breaks at a different weak point first. That is why category planning should follow the state the platform is in, not a flat benchmark table.
Category | India evidence | Meta behaviour to expect | What to watch |
Fashion/ apparel | Strong non-metro growth, lower discount dependence, and high festive sensitivity. | Fast creative fatigue in Q4, strong Reels and creator effect, deep remarketing pools in festive runs. | Hook rate, collection-page fit, frequency, and city-tier breakout. |
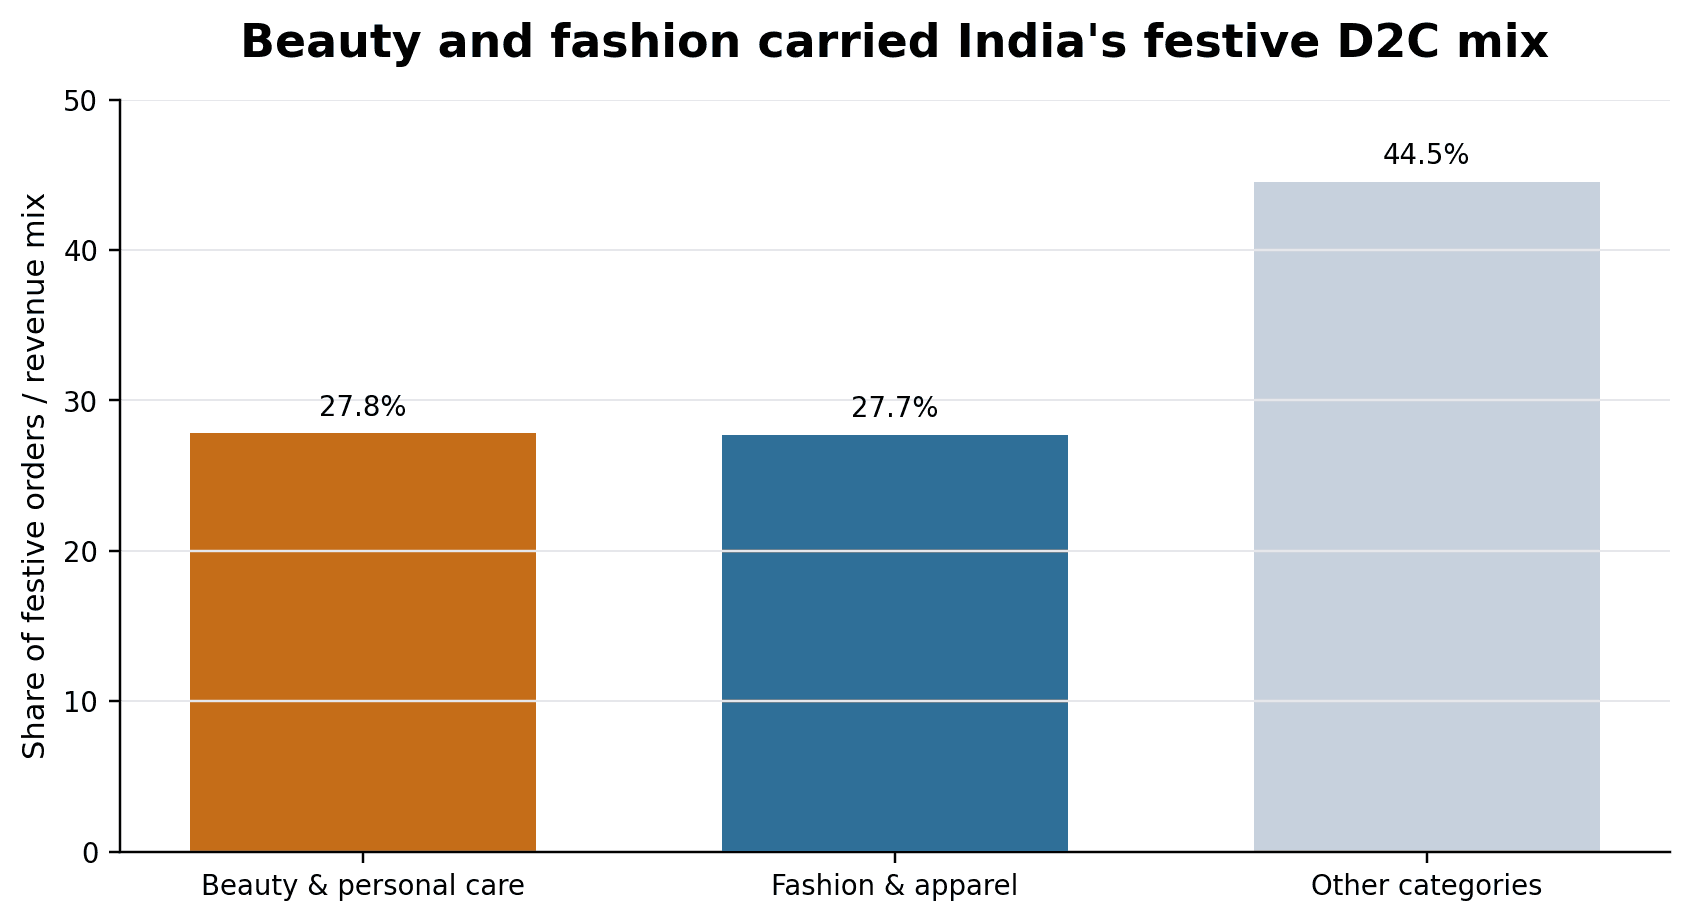
Beauty | Beauty got 27.8% of festive D2C orders. Nykaa's beauty business kept strong double-digit to mid-20s growth. | High trust sensitivity and fast creative wear-out. Reels and testimonial-style proof matter more. | Creative replacement speed, creator proof, and first-order to repeat-order economics. |
Electronics | Festive day 0 and day 1 growth was led by smartphones and TVs; quick-commerce and omnichannel retail are tightening response windows. | Higher basket value lets Meta pay more for the right user, but thin conversion labels make bad ramps expensive. | Budget ramp speed, offer clarity, and attribution lag. |
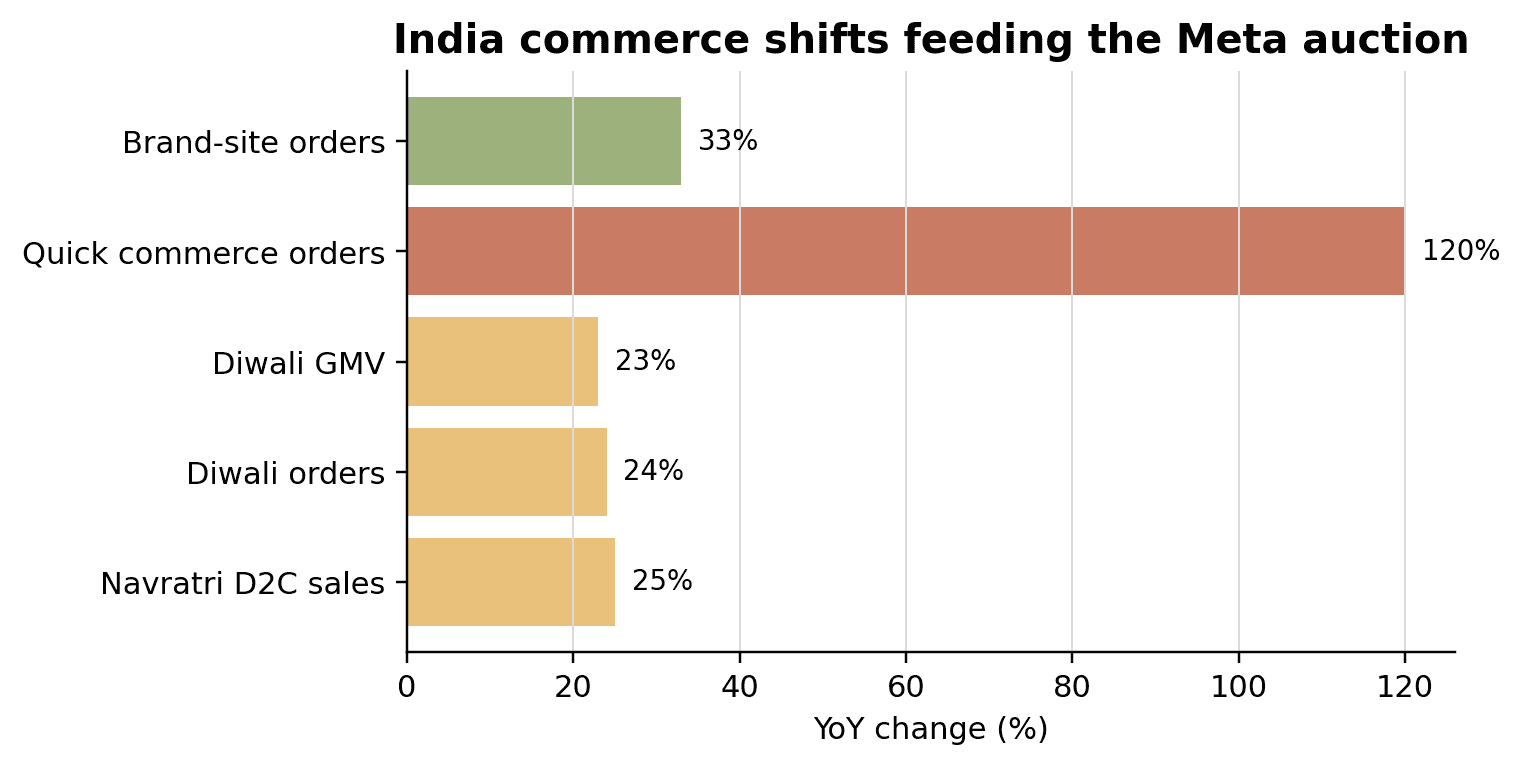
FMCG / quick commerce | 45% of festive shopping happened on quick-commerce platforms; nearly two-thirds of online grocery orders now route through quick commerce. | Meta gets faster feedback loops and more same-session conversion paths. | Catalog freshness, retailer feed quality, and creative built for impulse. |
How to budget once you accept that Meta changes state
A clean way to budget Meta in India is to match money to Meta's own operating state, then layer the India demand calendar on top.
The point is simple: do not spend the year as if every month is asking the platform to do the same job.
Window | Suggested share of annual spend | Primary job | Non-negotiables |
Jan-Mar | 12-15% | Testing, list building, signal repair, low-cost prospecting. | Longer read windows, server-side tracking, creative build cycle. |
Apr-Jun | 18-22% | Stable learning, creative scaling, offer refinement. | Do not wait for Q3 to build the next set of winners. |
Jul-Sep | 20-25% | Audience warming, catalog prep, stepped budget ramp. | Control ramp speed and replace weak creative before the festive auction tightens. |
Oct-Dec | 40-45% | Scale proven units, harvest demand, defend conversion quality. | Daily marginal CPA checks, frequency control, faster creative swaps, clean checkout. |
REGIONAL AND LANGUAGE SHIFT
The old metro-only media map is gone
Regional demand is no longer a side bet. Brands were pushing 25-40% of festive budgets into regional and Tier 2/3 activity, while digital CPMs were up 15-30% and, in some cases, 25-30% year on year.
That is a direct clue for Meta planning: local-language creative is now both a scale tool and a cost pressure zone.
Signal | Why it matters |
Budget reallocation | 25-40% of festive budgets moved toward regional and Tier 2/3 campaigns in festive 2025. |
CPM pressure | Experts in the same report said regional vernacular digital CPMs rose 15-30%, with some quoting 25-30% year-on-year increases. |
Channel split | One agency estimate in that report put around 65% of D2C regional festive spend into digital. |
What it means on Meta | Regional reach is still cheaper than metro saturation in many cases, but the cheap inventory story is weakening. Brands that wait too long pay more for weaker creative fit. |
Bottom line
Meta in 2026 rewards accounts that treat the year as a moving system, not a flat media channel.
The winning posture is simple but not easy: broad enough structure, fast enough creative refresh, clean enough data, and disciplined enough seasonal planning.
Executive checklist
What state is the account in right now: Q1 weak truth, Q2 stable read, Q3 rising auction, or Q4 harsh scale?
Are rising costs coming from auction pressure, rising frequency, or weaker conversion truth?
Are we reading the dashboard too early for this quarter?
Is creative tiring because the market changed, or because the asset is weak?
Are regional expansions being backed with real local creative rather than translated copies?
Are we paying peak-season prices on a weak conversion path?


